This report was prepared by: [Your Name], [Your Company]
Executive Summary
Here's where you'll give an overall summary on what you worked on and how things are going.
INCLUDE SUMMARY e.g. Implement SalesSpot's automation suite for efficient sales processes, reducing manual tasks and boosting sales efficiency.
INCLUDE SUMMARY e.g. Develop an internal training program to increase platform understanding and aim for 30% user growth.
INCLUDE SUMMARY e.g. Use SalesSpot's CRM analytics to understand customer behavior and sales trends, strategize effectively and target a 20% revenue growth.
What's going well
ADD POINTS BELOW e.g.
Strong user engagement
Effective CRM use
Positive customer feedback
Areas for improvement
ADD POINTS BELOW e.g.
Sales data analysis
Team training needs
Integration optimization
Goals Summary
Reviewing progress against your quarterly objectives.
This table captures how we’ve performed against the goals agreed upon at the start of the quarter, with a focus on measurable outcomes and strategic alignment.
GOAL
TARGET
PROGRESS
STATUS
Increase qualified leads
+25% vs. Q2 baseline
+21% (189 vs. 156)
⚠️ Slightly behind
Improve engagement rate on social
≥ 4.5% average
5.2%
✅ Ahead of target
Launch paid LinkedIn campaign
Go live by March 15
Live on March 12
✅ Completed
Decrease cost per conversion
≤ R250
R263
⚠️ Needs further optimization
Implement GA4 tracking
Full setup & event tagging
90% complete
⏳ In progress
Legend: ✅ On Track | ⚠️ Slightly Behind | ❌ Off Track | ⏳ In Progress
Recommendations
Specify your key recommendations below based on learnings and insights:
INCLUDE SUMMARY e.g. Enhance the use of SalesSpot's CRM integration capabilities to ensure seamless data flow across all your sales platforms.
INCLUDE SUMMARY e.g. Leverage SalesSpot's dedicated customer support and training resources to improve user adoption and proficiency among your sales team.
INCLUDE SUMMARY e.g. Use SalesSpot's advanced data analytics features to gain insights into customer behavior, sales trends, and areas for growth.
PreviousQBRs
→ Add links to previous QBRs here
→ Add links to previous QBRs here
→ Add links to previous QBRs here
→ Add links to previous QBRs here
ClientDashboard
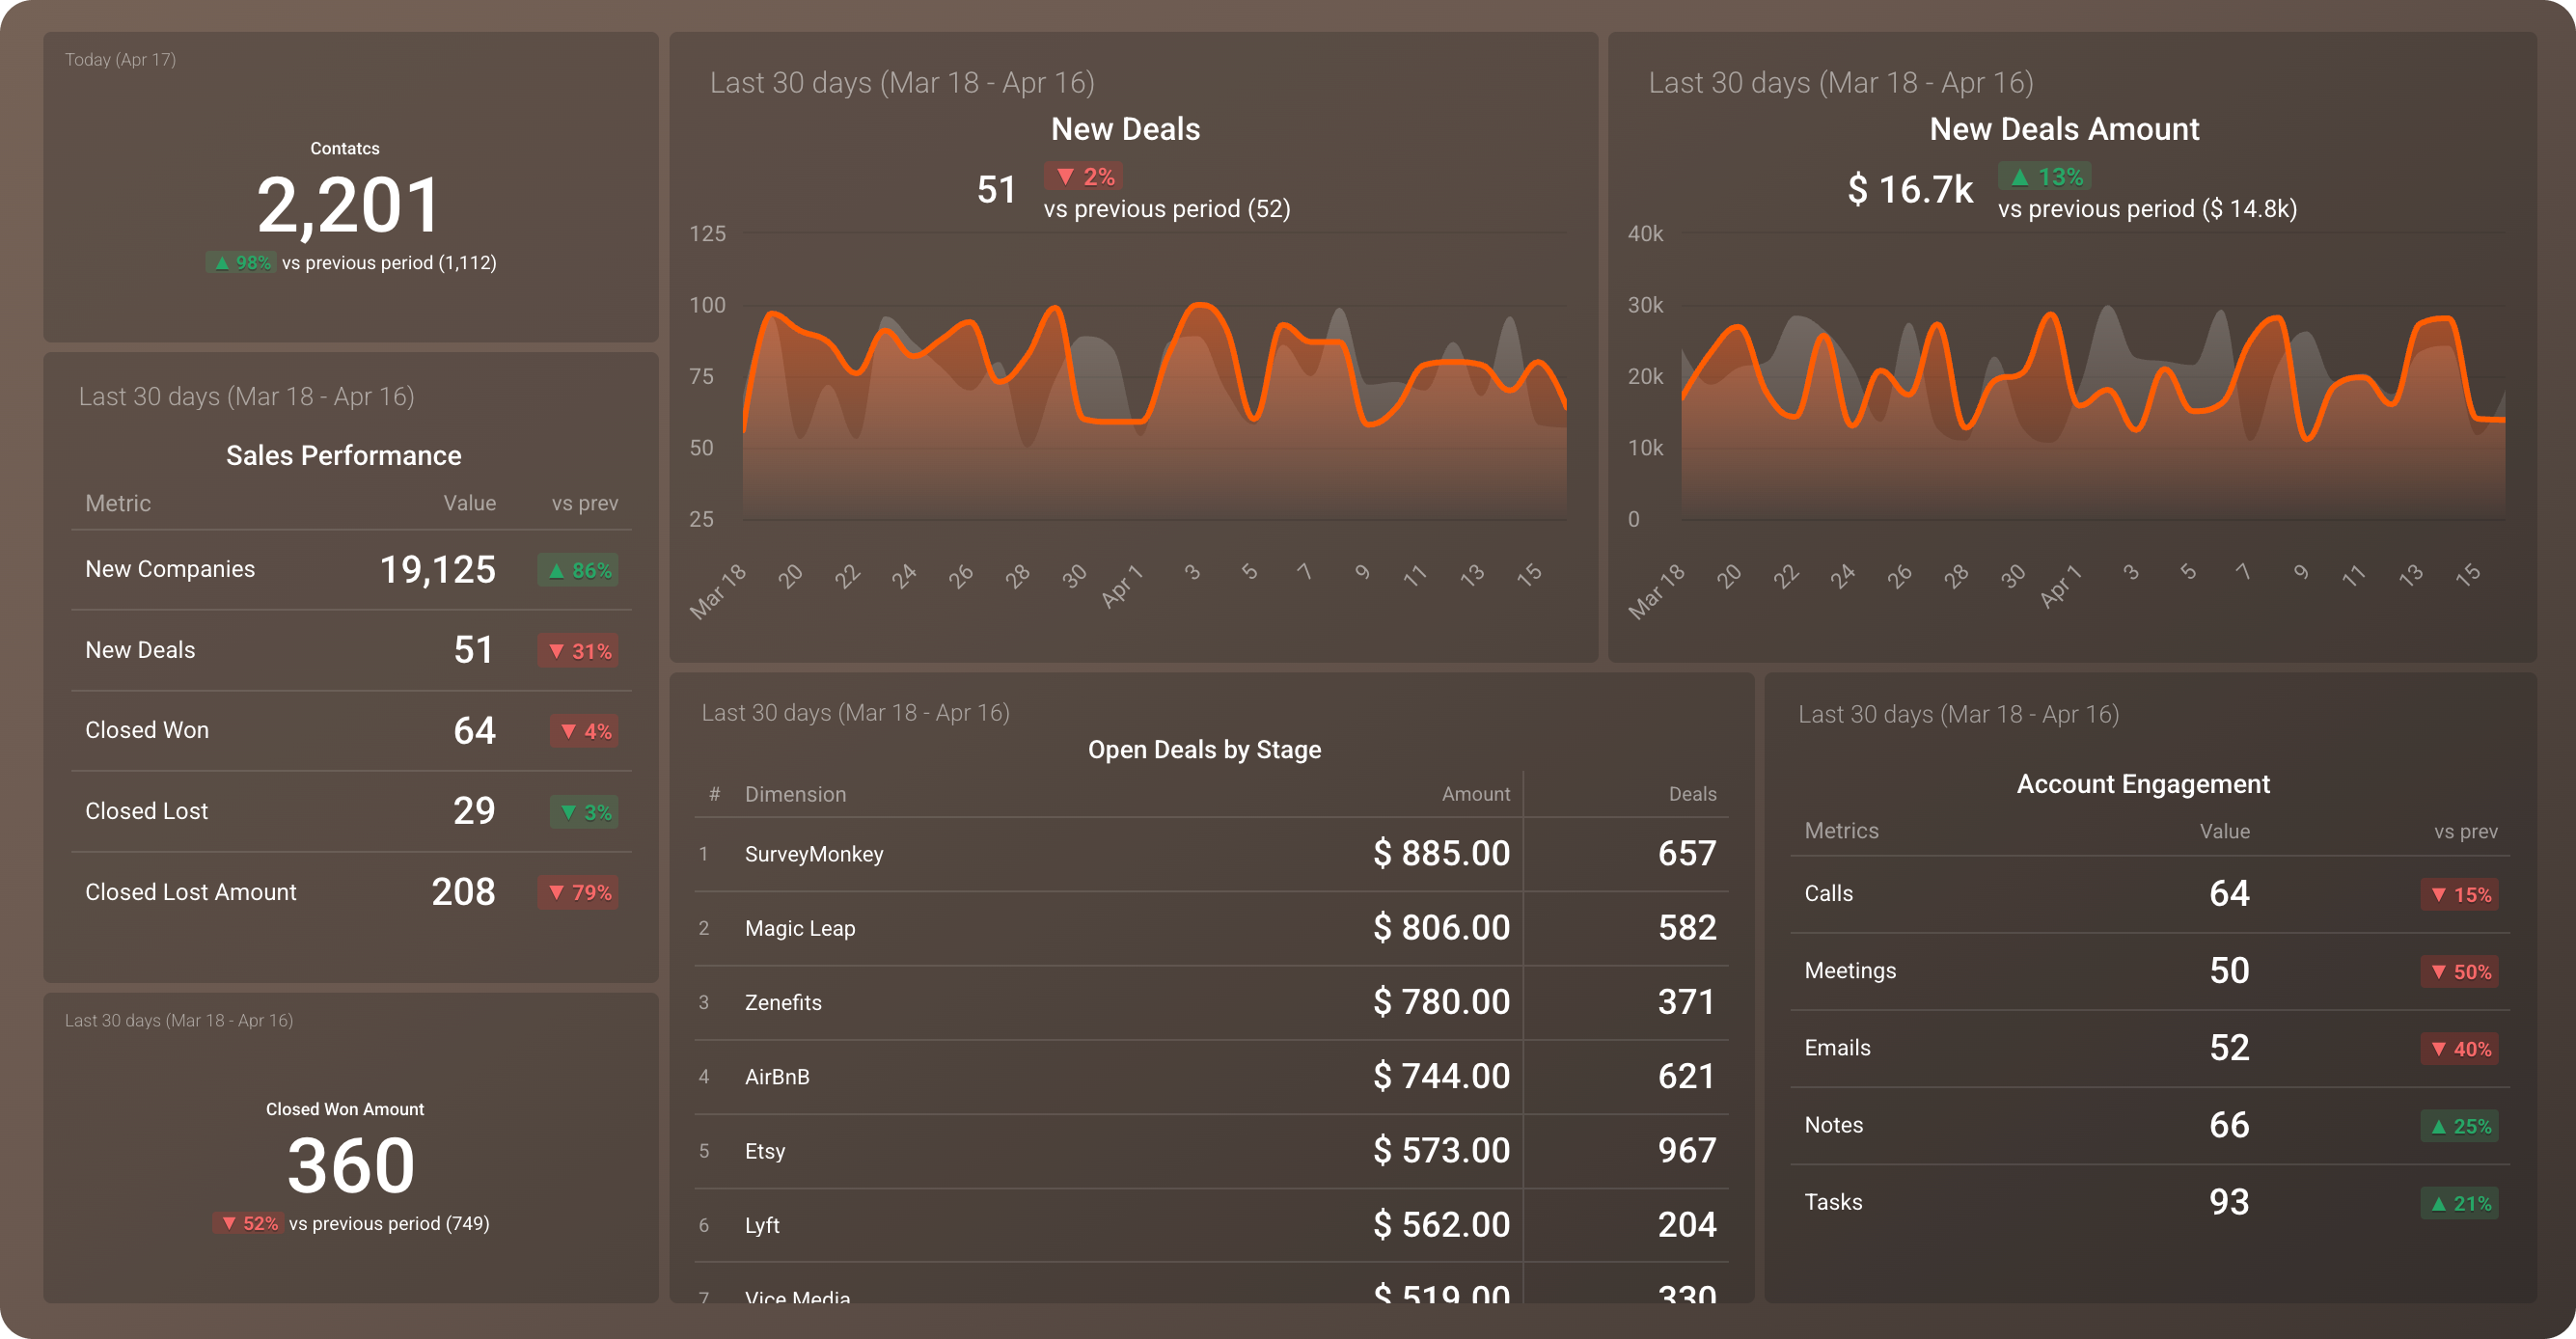
Here's where you can embed or share a live report. This could be from Looker, Tableau, or Google Data Studio like what you see below...
Add-on services
Package options:
Basic
$6,000.00 / month
1
Users
Basic support
Up to 5GB per month
Recommended
Standard
$8,000.00 / month
1
Users
24h support
Up to 10GB per month
Premium
$12,000.00 / month
1
Users
Priority 24h support
Unlimited storage
AI security monitoring
Done for you services
Subtotal
$250.00
Subtotal
$250.00
Description
Item
Quantity
Price
Advanced Campaign Testing
$500.00
$500.00
New Channel Activation
$250.00
$250.00
Quarterly Brand Health Audit
$250.00
$250.00
Total$250.00
ROI Calculator
84%
Savings per year
Next steps
ACTION
OWNER
DUE DATE
Approve Q2 priorities
[Client Name]
[Date]
Finalize budget adjustments
[Your Name]
[Date]
Launch updated campaign creative
[Your Team]
[Date]
About [Your Company]
[Your Company] is a leading SaaS company that empowers businesses to streamline their sales process and drive revenue growth.
Our innovative platform combines robust CRM functionality with advanced sales automation capabilities, enabling businesses of all sizes to manage customer relationships effectively, optimize sales operations, and make data-driven decisions. At [Your Company], we're committed to helping our clients achieve their sales goals through cutting-edge technology and unparalleled customer support.